Slicing
The user can perform slicing of a data set by either time or sample log (but not both). Data
reduction is performed separately on each slice according to the specified reduction parameters.
The output files will have a slice index appended to the configured "outputFileName", e.g.
myFileName_0_Iq.dat, myFileName_1_Iq.dat, etc.
Time Slicing
The user can specify time slicing to slice a run by time intervals and, optionally, a time period. The following parameters specify the time slicing:
{
    "useTimeSlice": true,
    "timeSliceInterval": 4800,
    "timeSliceOffset": 0.0,
    "timeSlicePeriod": null,
}
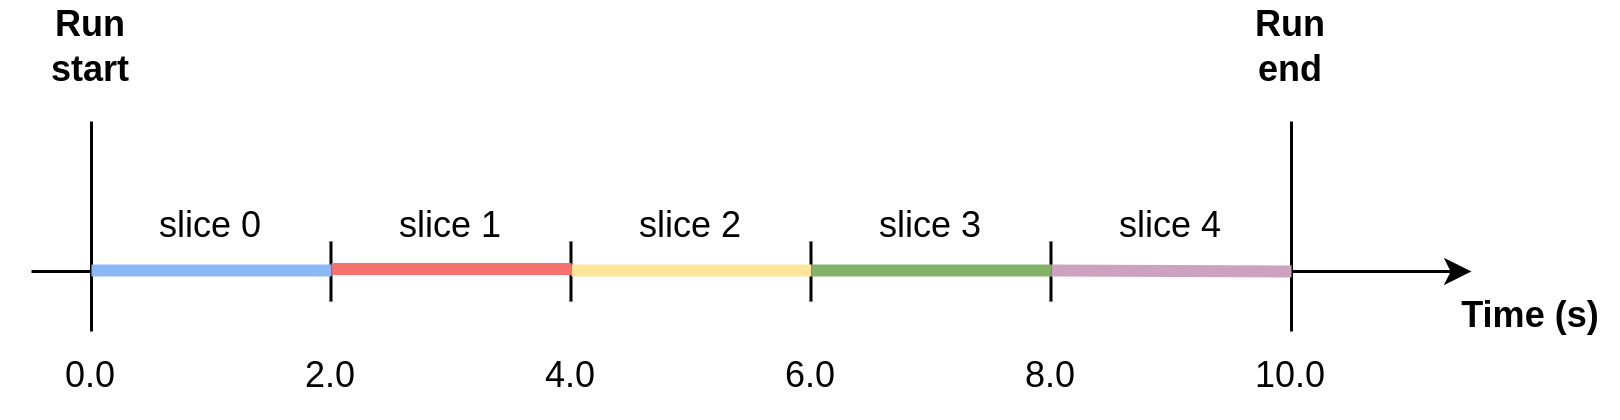
Example 1: Slicing using time interval
{
    "useTimeSlice": true,
    "timeSliceInterval": 2.0,
    "timeSliceOffset": 0.0,
    "timeSlicePeriod": null,
}
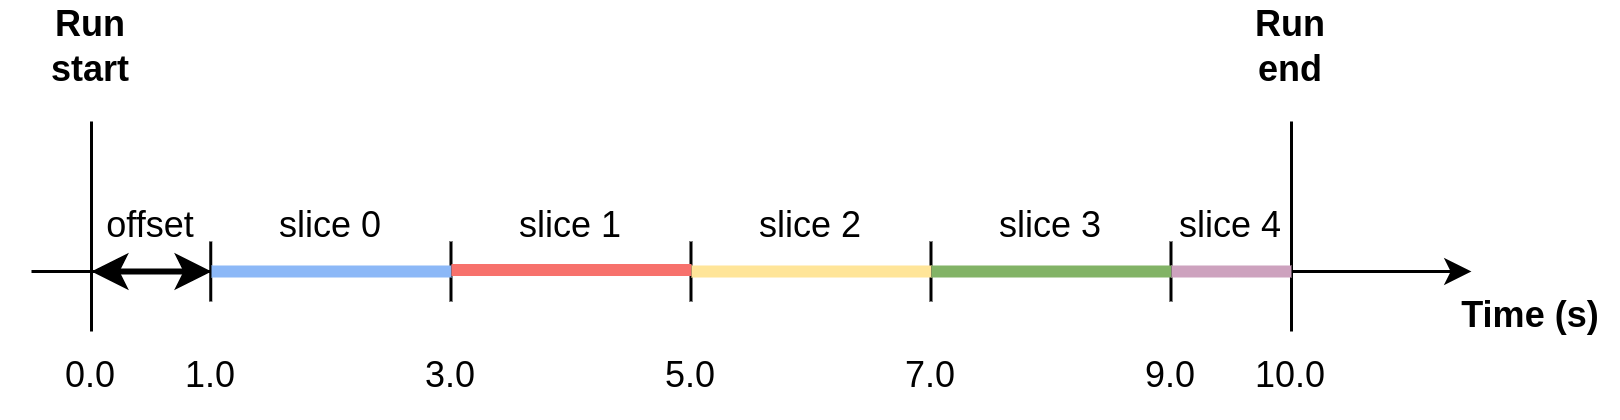
Example 2: Slicing using time interval and offset
{
    "useTimeSlice": true,
    "timeSliceInterval": 2.0,
    "timeSliceOffset": 1.0,
    "timeSlicePeriod": null,
}
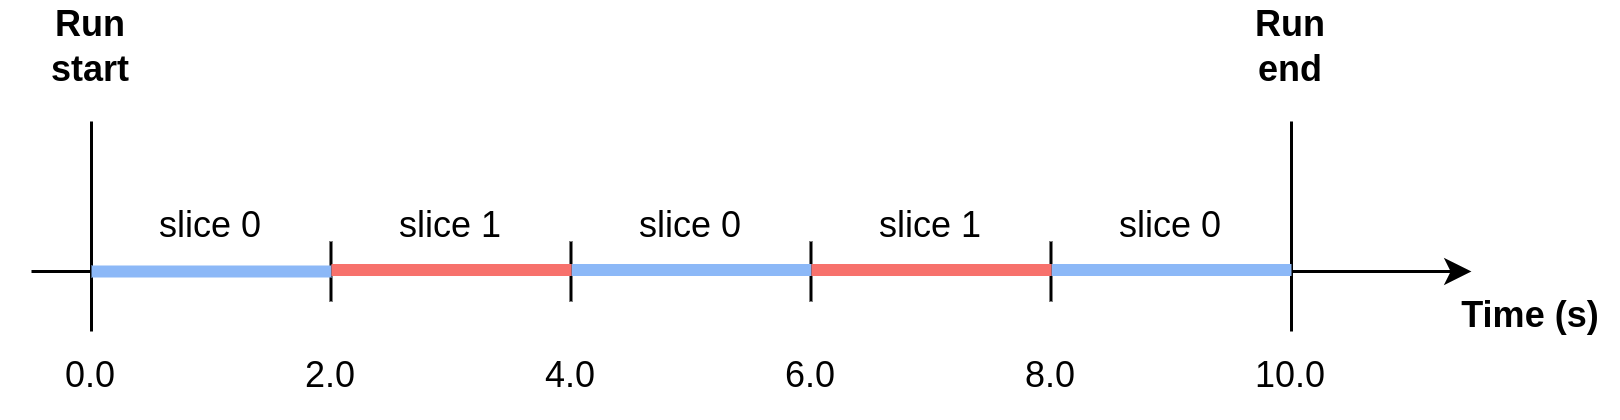
Example 3: Slicing using time slice period
When using a time slice period, slices for a given time interval are reduced together. In the figure, red slices are reduced together, and blue slices are reduced together.
{
    "useTimeSlice": true,
    "timeSliceInterval": 2.0,
    "timeSliceOffset": 0.0,
    "timeSlicePeriod": 4.0,
}
Note: if the time slice interval is a non-integer multiple of the period, then the remainder will be the last of the slices. In the example below, there will be two 3 second slices, then one 2 second slice.
{
    "useTimeSlice": true,
    "timeSliceInterval": 3.0,
    "timeSliceOffset": 0.0,
    "timeSlicePeriod": 8.0,
}
Log Slicing
Log slicing refers to slicing by the value of a sample log in the NeXus file corresponding to the sample run.
{
    "useLogSlice": true,
    "logSliceName": "MySampleLog",
    "logSliceInterval": 200.0,
}
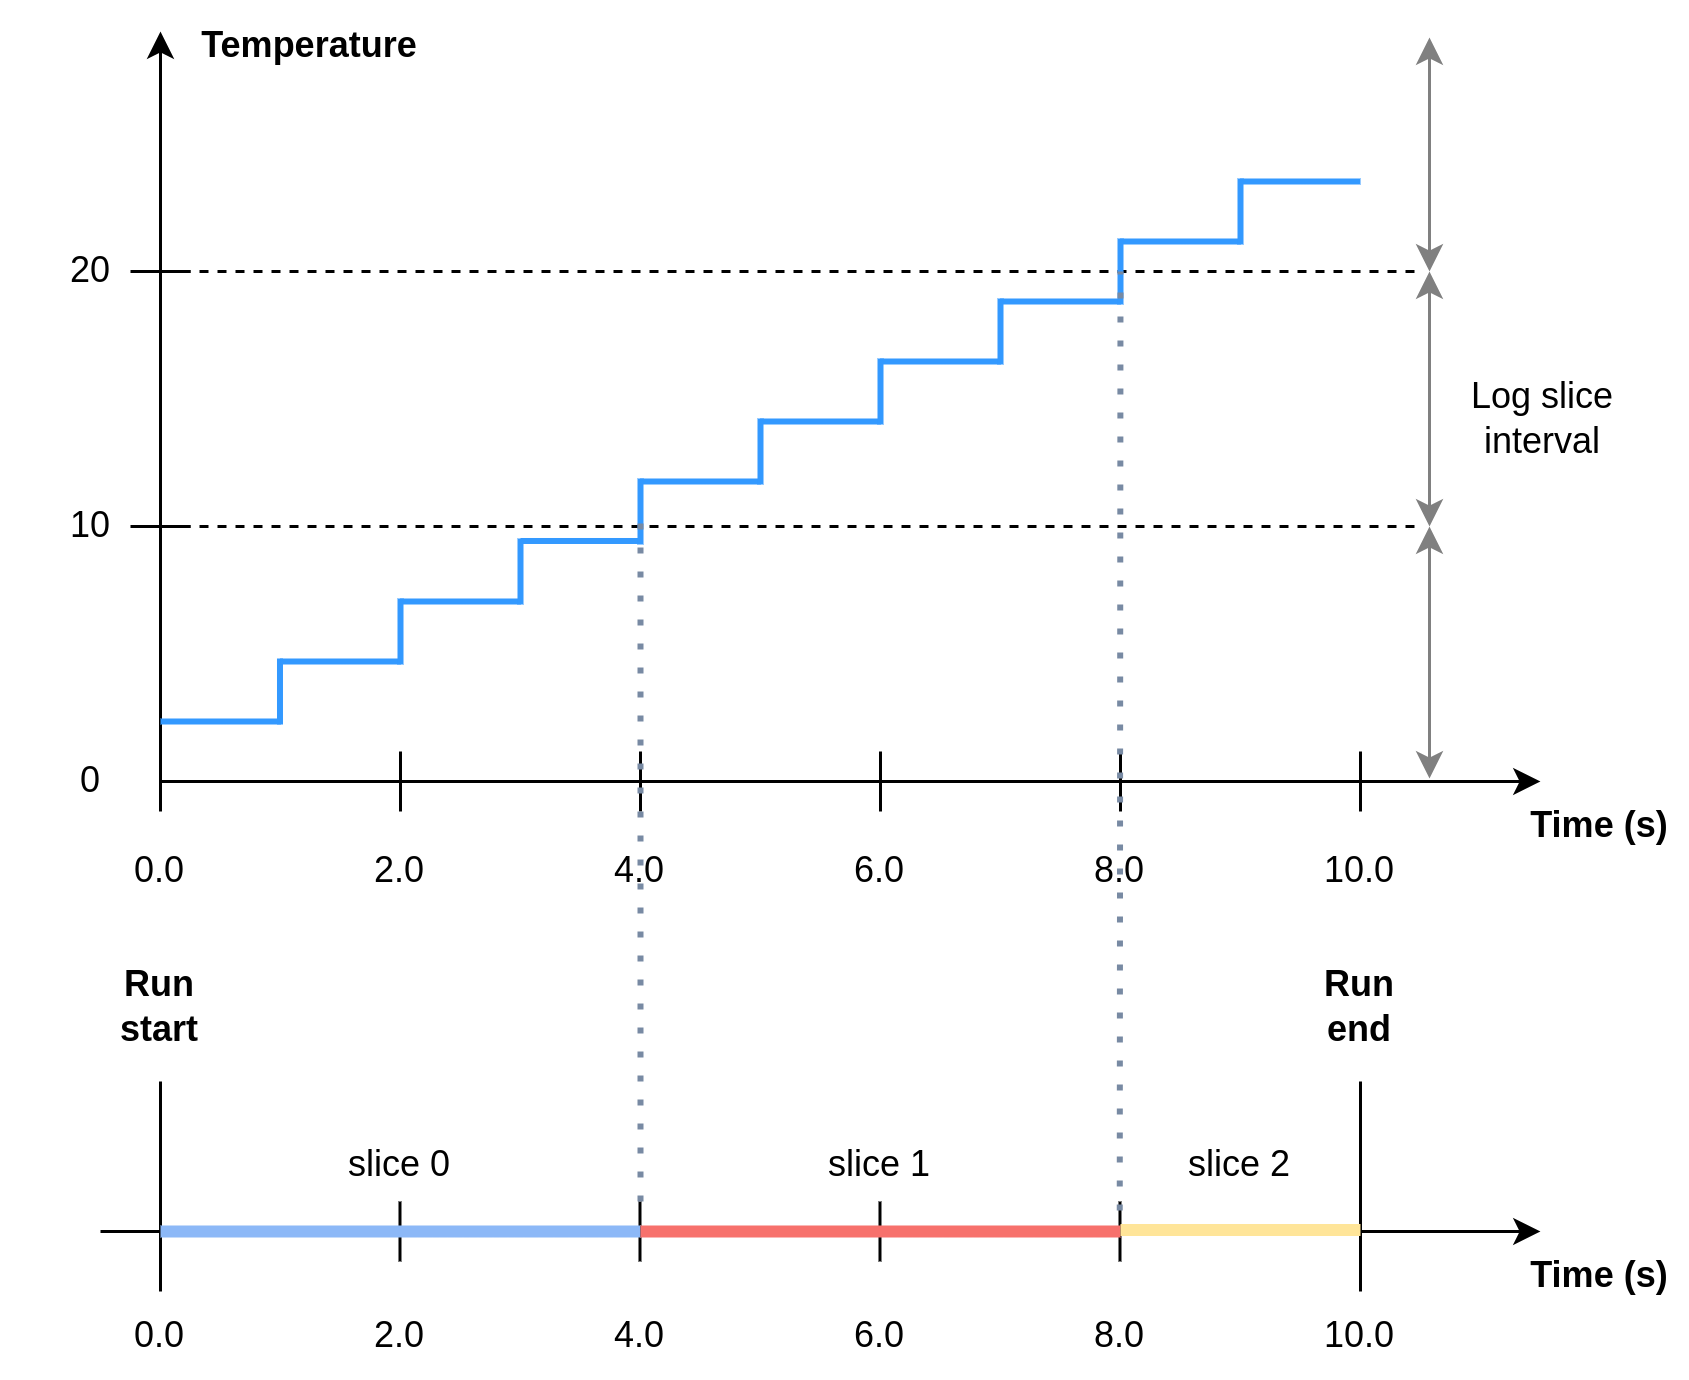
Example: Log slicing using log “Temperature”
{
    "useLogSlice": true,
    "logSliceName": "Temperature",
    "logSliceInterval": 10.0,
}
Slicing and Error-Weighted Binning
Note that using error-weighted averaging in combination with slicing may result in disparity between time sliced and non-time sliced data if there is not enough data in the slices for the error distribution to converge.
{
    "useErrorWeighting": true,
}
Figure 1 compares I(Q) for the whole run (blue dot markers) to I(Q) for time slices of the data (solid lines) for the time slice intervals 600 s, 1200 s, 2400 s and 4800 s. The time sliced I(Q) converges to the total I(Q) with increasing time slice interval.
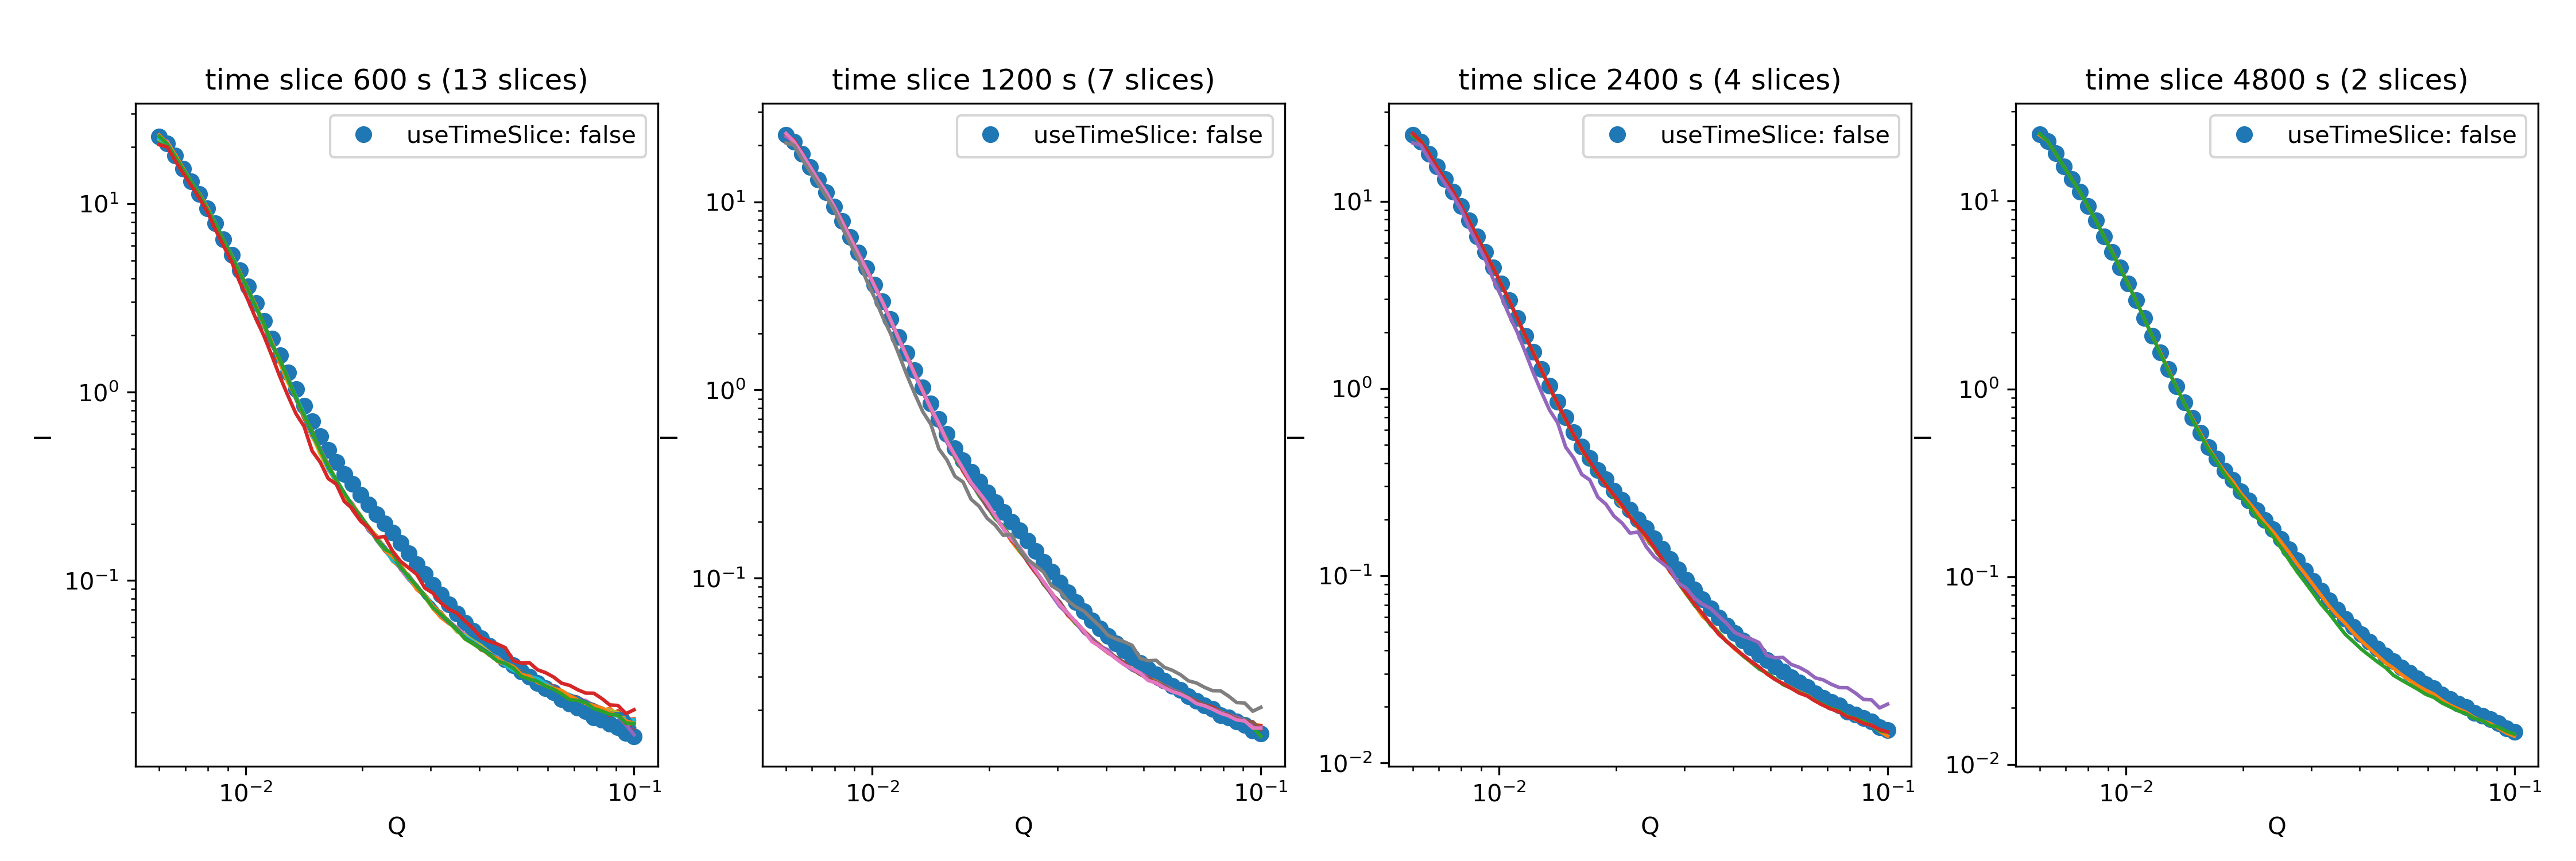
Figure 1: I(Q) for time slices of a run compared to the total run for different time slice intervals and
with error-weighted averaging ("useErrorWeighting": true).
In Figure 2, the same comparison between time sliced and non-time sliced data but with error-weighted averaging turned off (i.e. using arithmetic averaging) shows no dependence on the time slice interval.
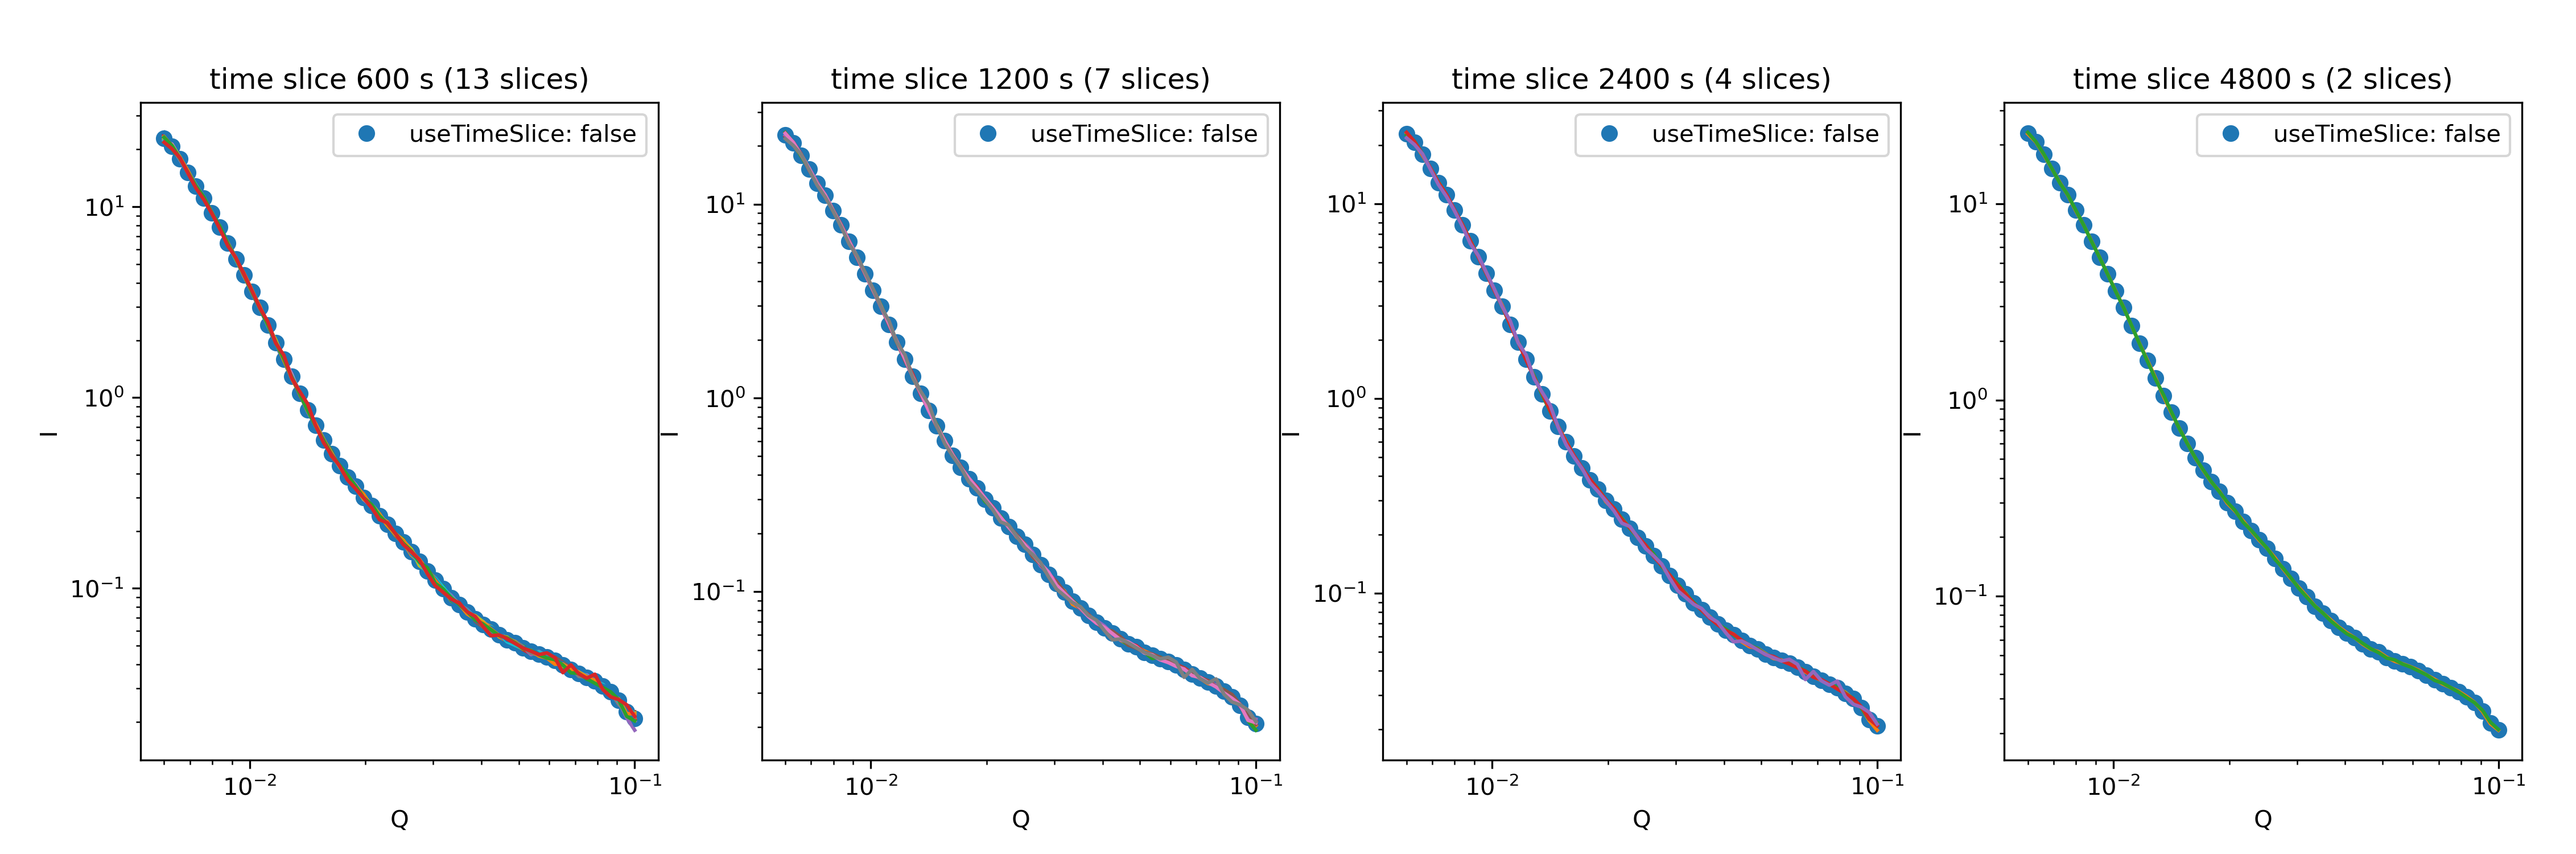
Figure 2: I(Q) for time slices of a run compared to the total run for different time slice intervals and
with error-weighted averaging ("useErrorWeighting": false).